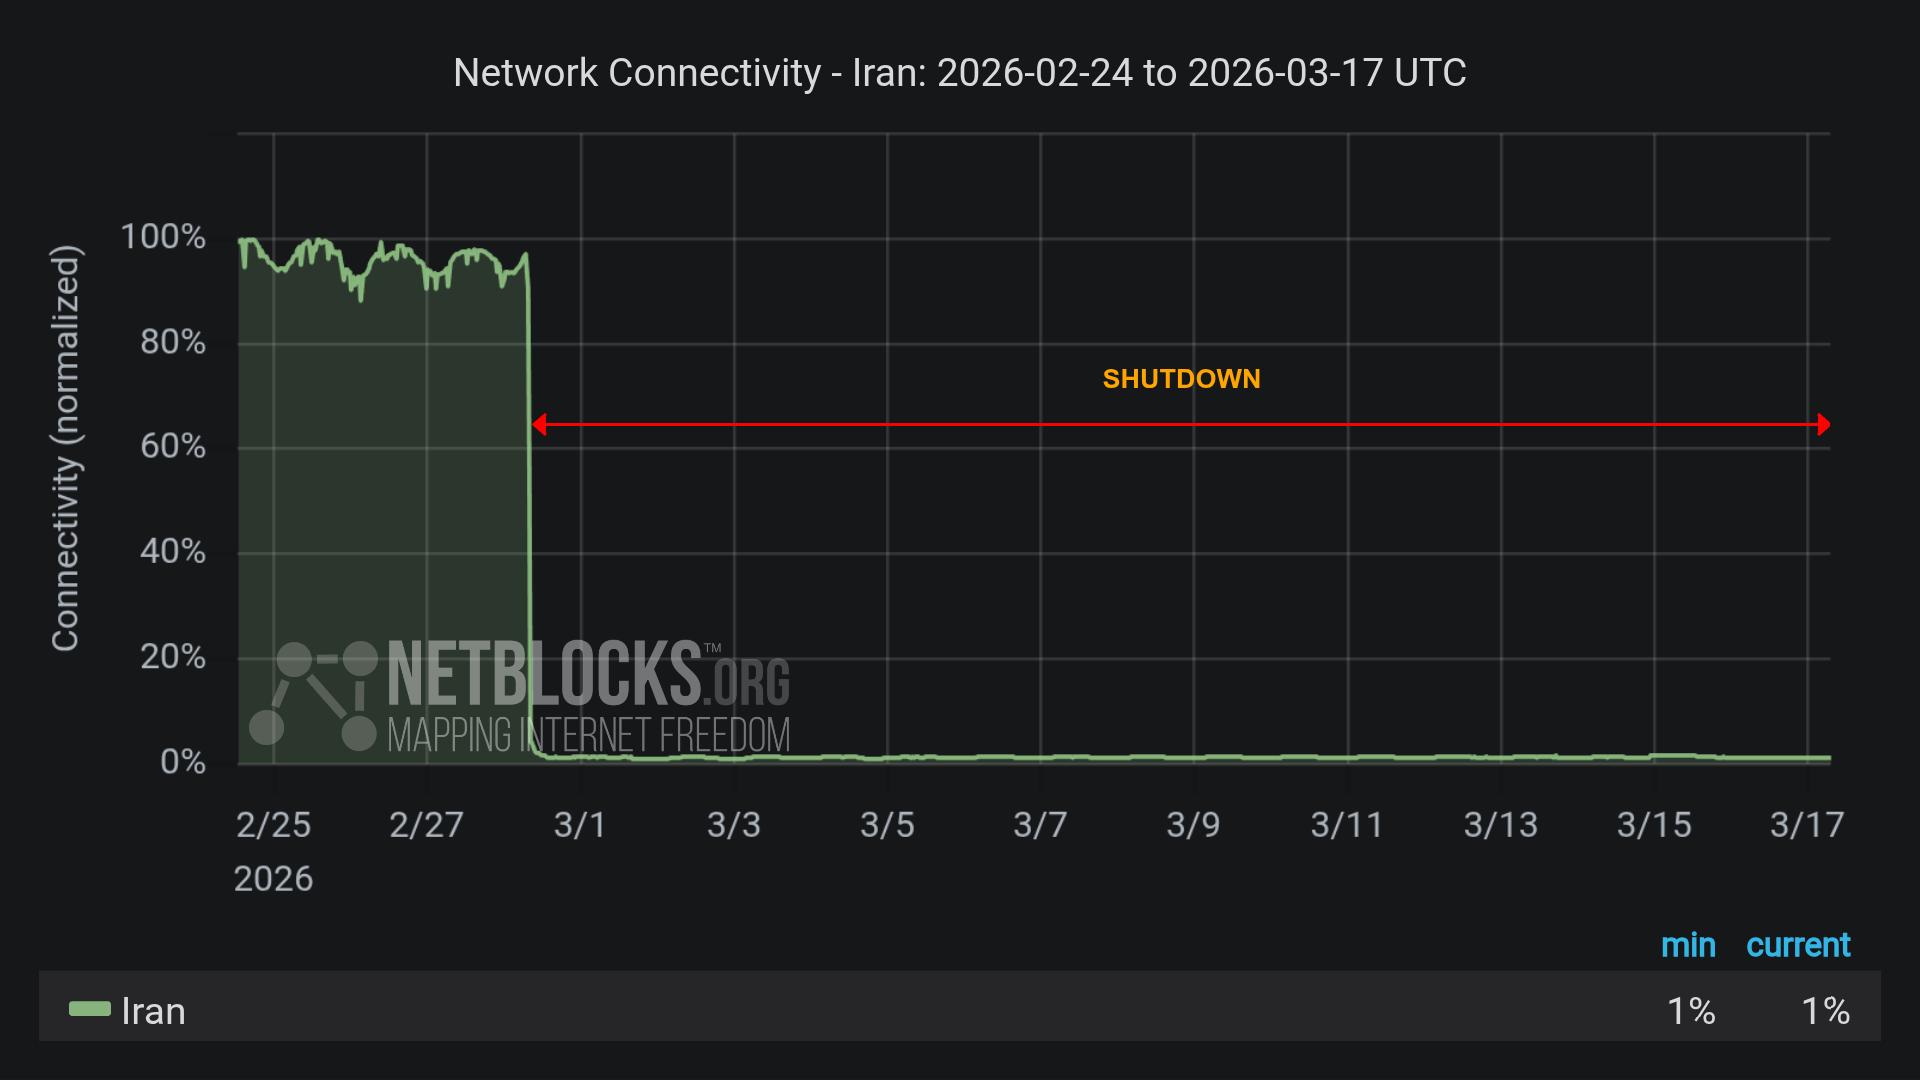
Graph from NetBlocks showing network connectivity in Iran from 24 February 2026 to 17 March 2026. The y-axis represents normalized connectivity, ranging from 0% to 100%, and the x-axis represents the dates. The green line representing Iran's connectivity is high through the initial time period, with a sharp drop on the morning of 28 February. The continued drop in connectivity aligns with a nation-scale internet blackout imposed by authorities after joint military strikes by the US and Israel. The minimum and current connectivity levels are indicated as 1% and 1%, respectively. The chart has a dark background with a red horizontal arrow labeled 'SHUTDOWN' indicating the disruption period, and the NetBlocks logo in the lower left corner with the Mapping Internet Freedom slogan.